Designing the virtual air barrier
 Test protocol
Monitoring began about mid-November and continued through to the end of April of the next year. During this period, the indoor humidity was increased from about 30 to 70 per cent RH in increments of 10 per cent every two weeks. Additionally, the VAB zone pressure was periodically increased and decreased to determine the minimal operating level that would prevent or limit VAB zone cavity condensation.
In addition to the exterior wall experiment, 13 windows were retrofitted to determine the most effective strategies to control surface and interstitial condensation.
Visual observations
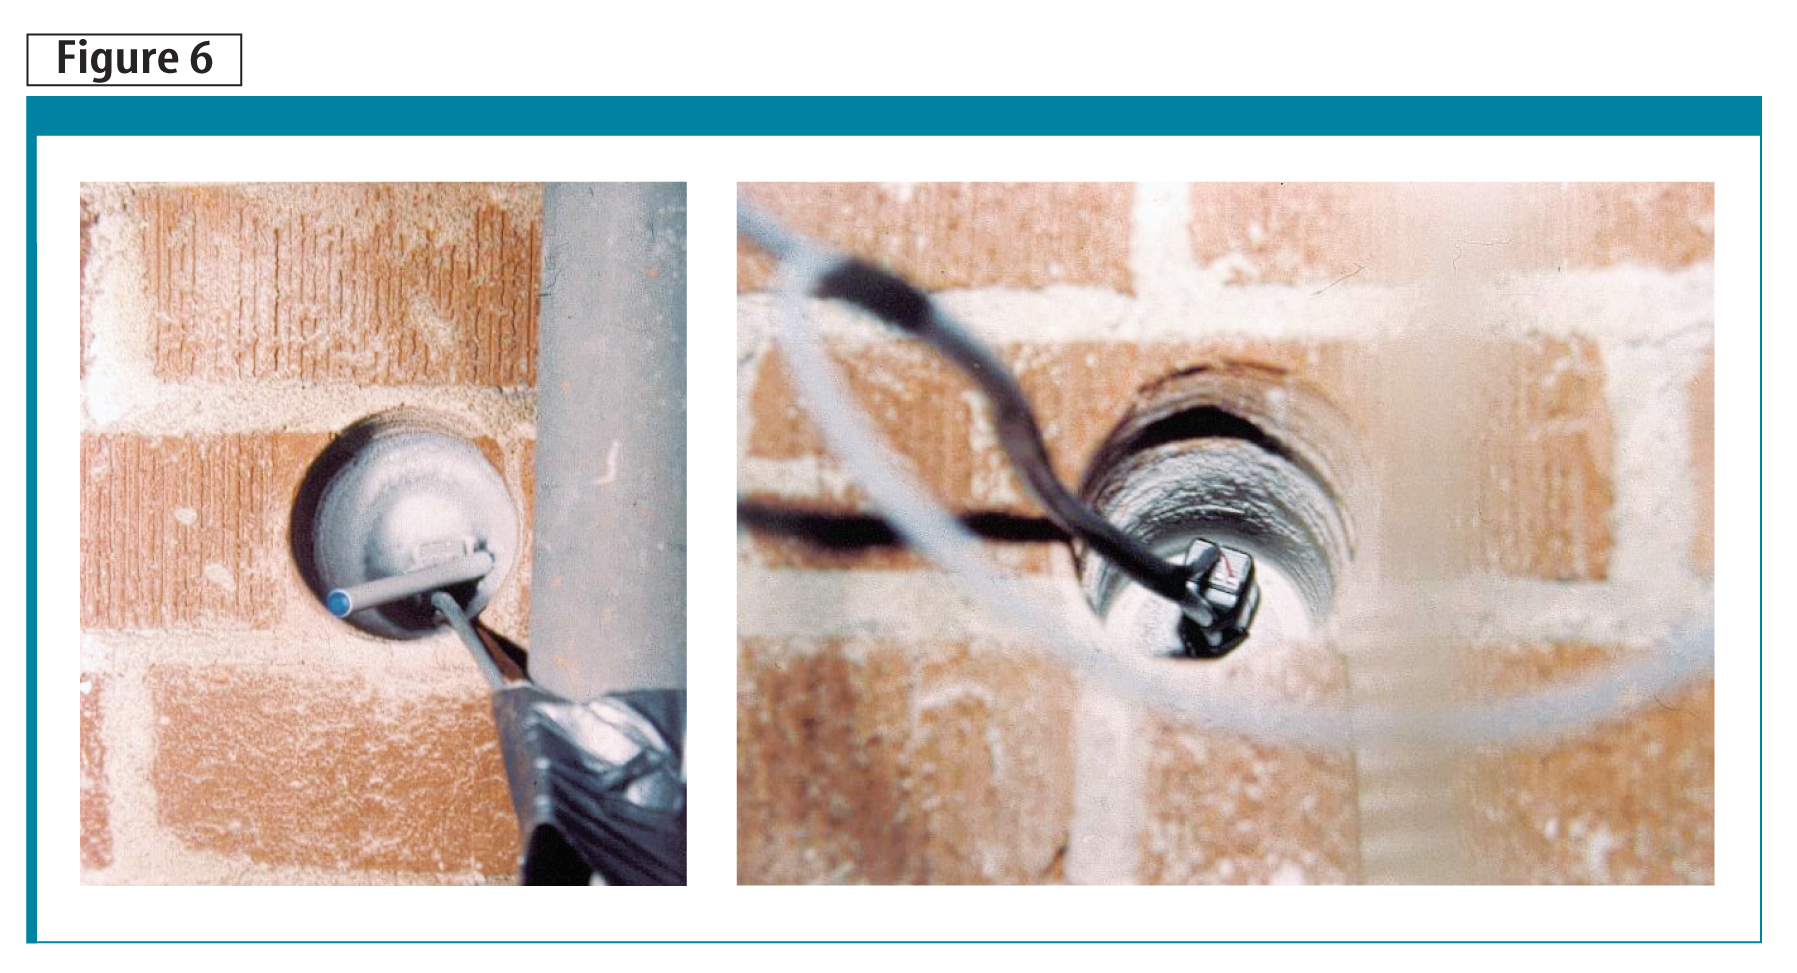
During the monitoring period, the conditions of the stone cladding, windows, VAB zone, and control wall cavity were visually observed and photographed each week. In mid-January, the cavities of the control wall and VAB zone were inspected through hatches and conditions photographed. Figure 6 shows the accumulated frost (condensation) within the hole drilled in the terra cotta of the control wall cavity; one can also note the absence of frost in the hole drilled within the VAB zone cavity. The indoor conditions were 20 C (68 F) with a relative humidity of about 50 per cent, and an average outdoor temperature of –10 C (14 F) at the time of observation. The control wall cavity pressure was lower than the indoor side by about –5 Pa (0.02 in.H2O) while the pressure of the VAB zone was higher than the indoor side by about +10 Pa (0.04 in.H2O).
On the exterior side of the wall, the VAB zone cladding was free of any moisture stress. The same was found of the exterior side of the control wall, but stress would not normally appear after a few years of exposure.
Electronic observations
Every week, the data-loggers were downloaded to files and plotted for later analysis. Plots of both the control cavity and VAB zones’ pressure difference history, relative to the indoor side, were examined and analysed. If the pressure difference of the VAB zone was found positive with respect to the indoor side, then the pressure system was functioning as required. It also confirmed the change in direction of any air leakage and the prevention of the indoor air from leaking into the VAB zone of the wall.
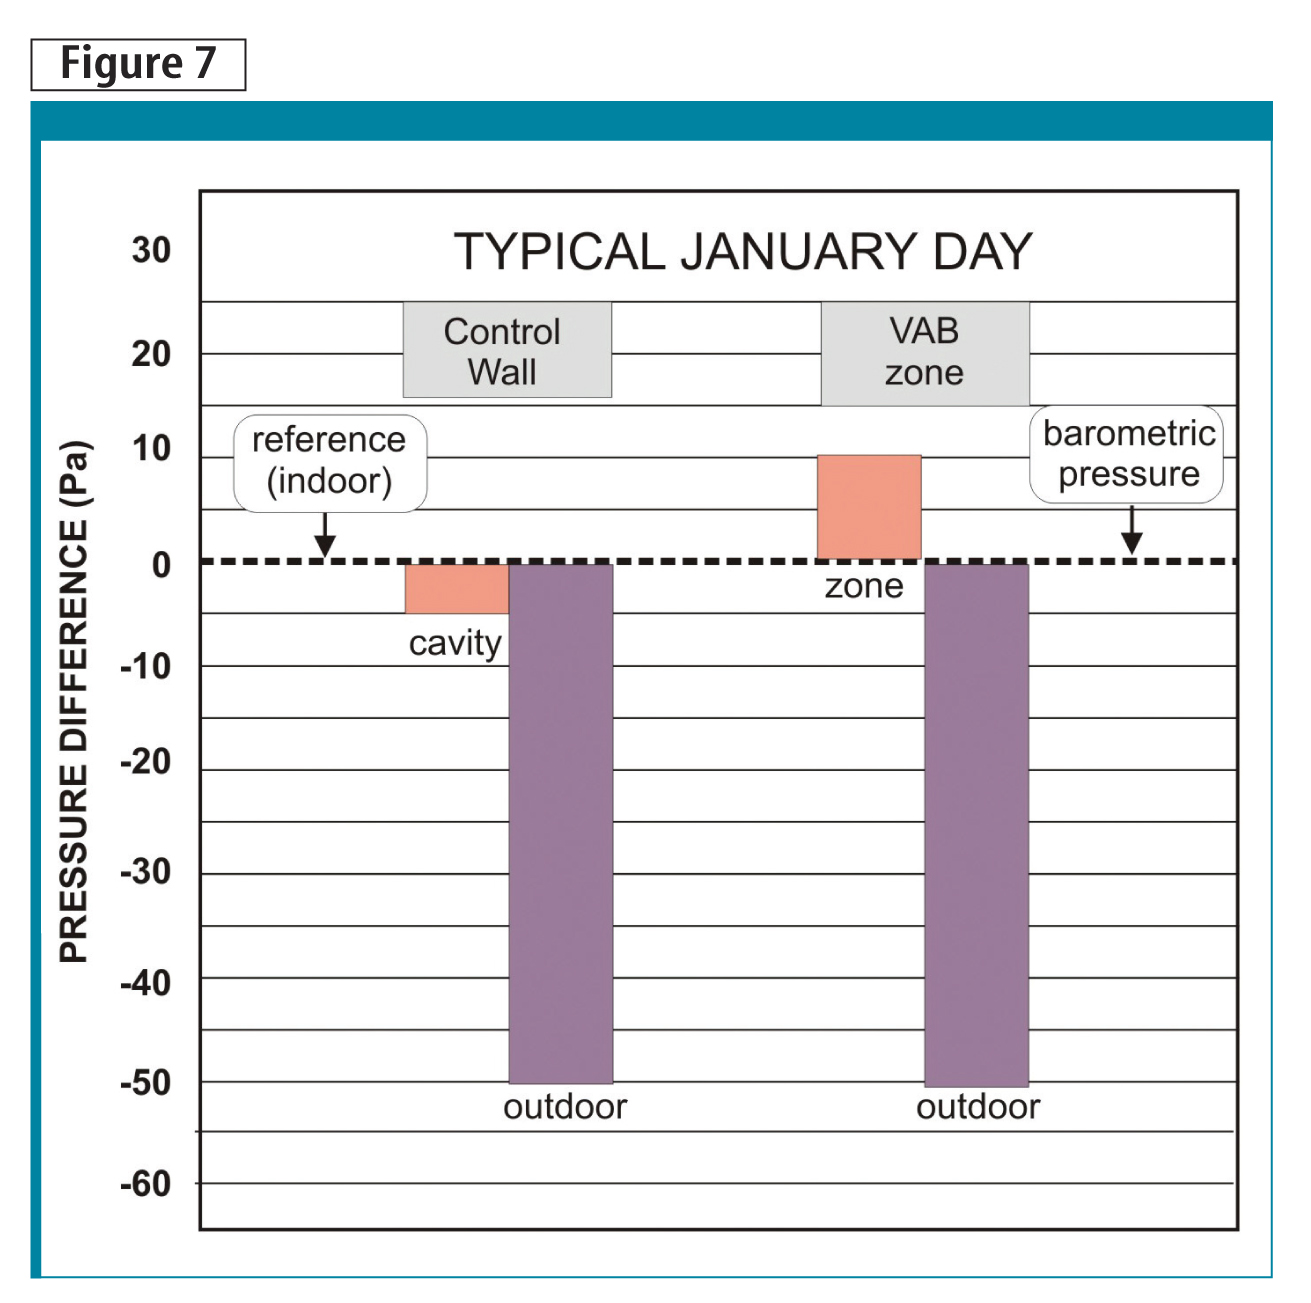
Figure 7 is a bar chart of the recorded pressure differences to show the differences between the control and VAB exterior walls with respect to the indoor side. The control cavity pressure is 5 Pa (0.02 in.H2O) below (negative) the reference pressure (the indoor or room side). Further, the indoor pressure is 60 Pa (0.241 in.H2O) higher than the outdoor pressure. This is partially due to stack-effect pressure within the building and also to building ventilation pressure.
The push of the small but negative pressure difference thereby induces air infiltration into the control wall cavity and over the back side of the cladding assembly. The cavity air then leaks to the outside through imperfections in the cladding assembly (i.e. cavity surfaces and at the drilled hole) after depositing condensation and within the control wall (as shown in Figure 6).
Similarly, the VAB zone pressure was found to be 10 Pa above the reference pressure of the indoor side. This is a positive pressure difference with respect to the indoor side. This difference was sufficient to prevent air leakage into the wall cavity of the VAB zone. Therefore, no humid air entered the VAB cavity, and no condensation was found (as shown in Figure 6).
The analysis also involves examining the temperature and humidity records the VAB zone data. An actual data plot of the VAB dewpoint temperature was prepared. The temperature and RH of the air within the VAB was then converted to a dewpoint temperature and compared with the outdoor temperature.
In Figure 8, the VAB system was allowed to function for several weeks uninterrupted. It was then turned ‘off’—meaning the supply air fan to the VAB zone was off for 24 hours. The rise of the dewpoint temperature can be seen in the graph as humid indoor air pushed into the VAB zone as the virtual air barrier space’s pressure collapsed. The dewpoint temperature within the VAB cavity rose well above the outdoor temperature, indicating potential condensation conditions.
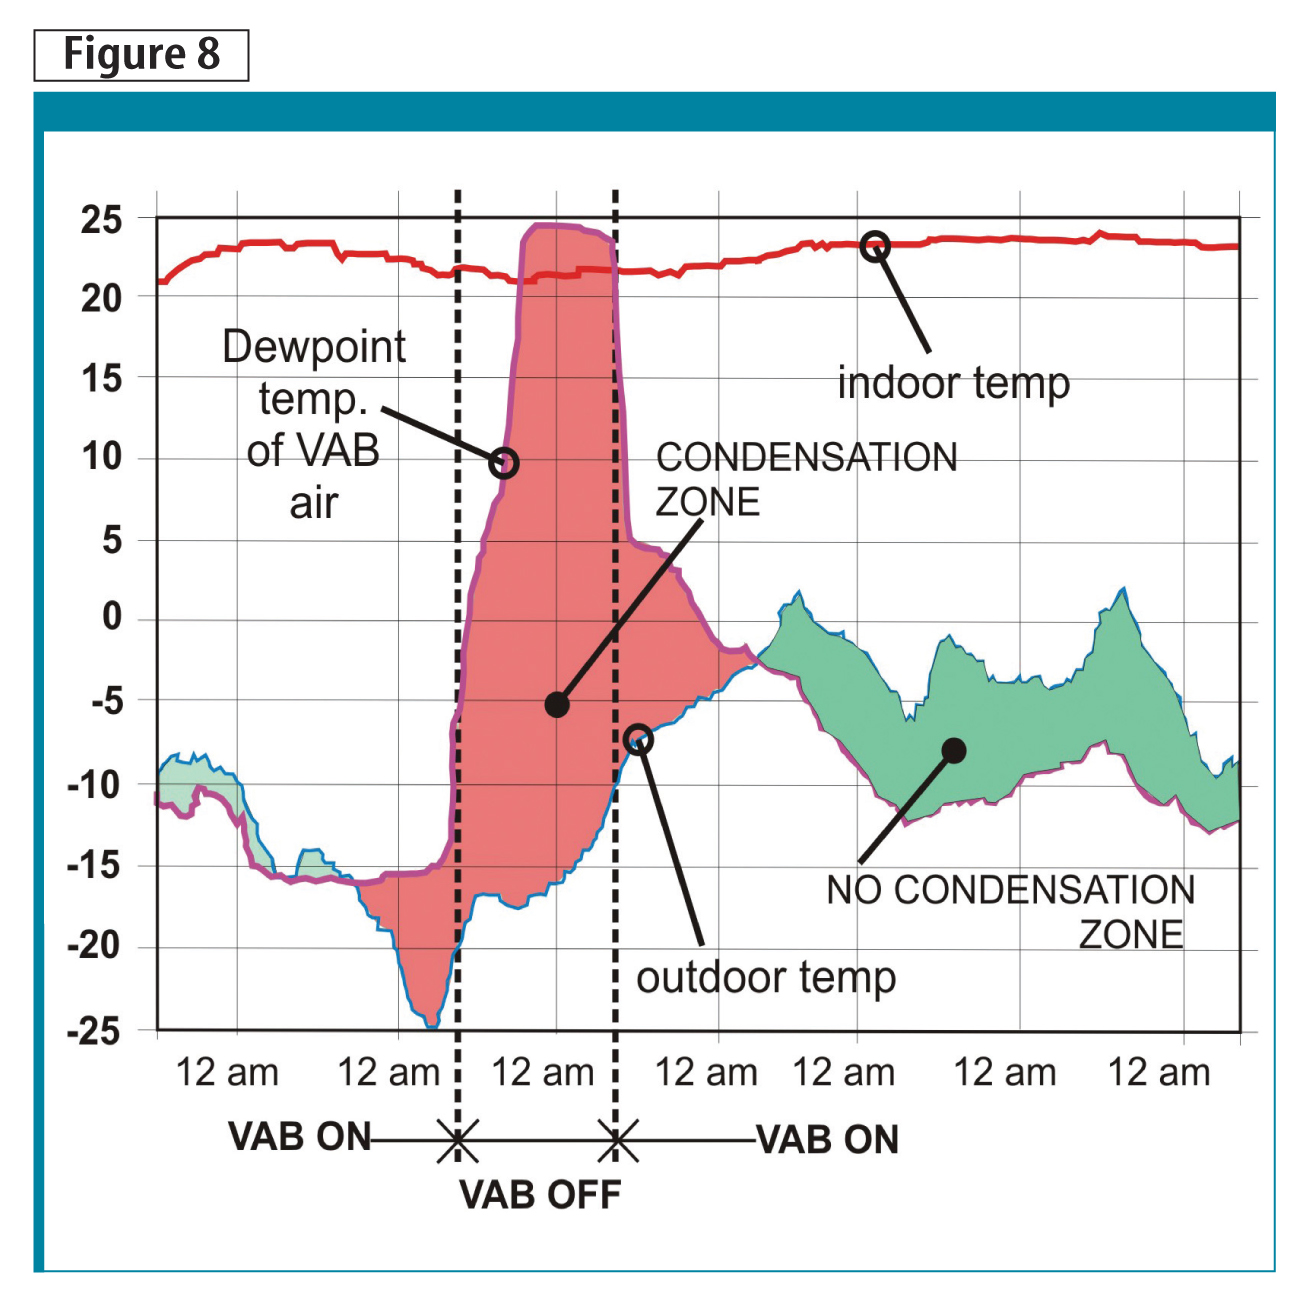
When the VAB supply fan was restarted, the dewpoint temperature rapidly dropped once again to a level below the outdoor temperature within a few days. It is this effect that prevents condensation from occurring within exterior wall and roof cavities when a virtual air barrier system is installed.
The VAB was also examined to determine the range of air pressure differences governing its ability to control condensation. It was found the VAB zone’s pressures difference could be so low it was undetectable, yet it was still effective in controlling condensation. Further consideration noted when the wall cavity or VAB zone is airtight, very little supply air is required to obtain adequate pressure to prevent the entry of humid room air into the wall cavity.
Alternately, when the VAB pressure difference was found to be small and the fan supply was near its maximum, the VAB air was diluted with outdoor air to a dry condition, which also produced a dewpoint temperature below the outdoor temperature—a win-win situation when both pressure and flow produce the desired results. The only time the VAB system did not perform as expected was when the VAB system supply was shut down.
Sign up for our weekly newsletter
Construction Canada weekly newsletters give the latest AEC industry news for those who build, design, engineer, specify, renovate or operate in the built environment.
Products & Services
Read the Latest Issue