Air tightness testing in large and multi-zone buildings

Air leakage in buildings, often referred to as “air infiltration/exfiltration” or “uncontrolled air flow,” is the unintentional movement of air in and out of a building through gaps, cracks, holes, and other openings in the building envelope.1 It is predominantly driven by pressure via wind, stack effect, and induced pressure by building ventilation systems.2 Air leakage is a significant concern in the construction industry since it can considerably increase building energy consumption and result in moisture damage in assemblies as a result of interstitial condensation, comfort issues from local drafts, and poor indoor air quality (IAQ) due to introducing pollutants and allergens from the outside.3
Measuring building air leakage at normal (operating) conditions is extremely difficult and time-consuming due to the variability of in-situ conditions.4–6 As a result, air leakage of the building enclosure is typically tested at an artificially elevated pressure difference between the test space and ambient pressure to negate the “noise” of the stack effect, wind, and humidity pressures, where the results are extrapolated to determine the air leakage at operating conditions.7 The initial assessments of building airtightness using pressurization methods involved the use of various prototypes of pressurization equipment, primarily driven by the need to address heat loss issues.8–12 The practice of employing fan-based pressurization or depressurization techniques for whole-house air leakage testing gained popularity in the 1980s, initially in Sweden as a window-mounted fan13–15 and the United States.16–18
Following the oil crisis of 1973, many countries developed policies aimed at reducing energy consumption in their national building stock.19 The first airtightness testing standards for North America were ASTM E779-81, Standard Test Method for Determining Air Leakage Rate by Fan Pressurization, and the Canadian standard, CAN/CGSB-149-GP-10M, Determination of airtightness of buildings by the fan pressurization method.20–22 These standards included requirements regarding flow rate, wind speed, pressure measurements, and overall uncertainty of the test.
Airtightness testing for small and single-zone buildings, such as single-family homes, is well understood, and many practitioners across the world can perform the test in accordance with the applicable standards. There is a large database of airtightness for houses; a recent review on airtightness testing outlines a few resources such as Walker’s residential diagnostics database (ResDB) including 75,000 entries in 2013, the ATTMA database in the UK including 192,731 records in 2017, and national database in France containing measurements of approximately 219,000 tests in 2019.20,23–25 The test for small single-zone buildings can be conducted by a single fan. For dwelling units that share a wall with another unit (e.g. row houses), the air flow through the partition wall can be cancelled out by simultaneously running the fan for the test space and the fans for adjacent suites (i.e. guarded test) to keep all zones at the same pressure.26 Nonetheless, the tests for small buildings are straightforward, and minimal building preparation is required.
Contrary to single-family homes, there is no large database available for the airtightness of large buildings. Previous research frequently highlights the limited availability of measured data for the leakage rates of large buildings. A review study on airtightness of apartment and commercial buildings states that “the available database is extremely deficient”;27 in addition, the literature review conducted states that “the literature on air flow and air leakage measurements in high-rise multifamily buildings is quite limited.”28 Due to the scarcity of available data, a research project (ASHRAE 1478) was performed to measure enclosure airtightness of 16 non-residential mid- and high-rise buildings in the United States.29 Another study conducted a comprehensive literature review and gathered large building airtightness data for 566 buildings, of which only 16 per cent of buildings (~90 buildings) are located in Canada.30
The primary reason for the limited data available for large buildings is attributed to the greater complexity of the testing process, the absence of regulations, and the need for large-scale equipment. Typically, taller buildings are exposed to higher wind speeds combined with a much larger stack effect. Such large bias pressures make it difficult to collect reliable data for mid- and high-rise buildings. In addition, there will often be several days of preparatory work to seal intentional openings. Also, the size of some buildings requires many fans to be set up with a complex arrangement of data cables and pressure tubes.31
To address the knowledge gaps in literature, the main objectives of this study are as follows:
- Provide additional performance data for large buildings airtightness to address scarcity of available measurements
- Compare the measured values with the existing literature to establish a benchmark for large building airtightness in British Columbia
- Evaluate the impacts of different air barrier strategies on large buildings airtightness
In this study, the results of airtightness testing for 29 buildings are presented (20 new construction and nine existing buildings). The data was obtained over a span of four years, encompassing more than 500,000 m3 (17.7 million cf) of volume and 145,000 m2 (1.5 million sf) of floor area for buildings ranging from one to 21 storeys. The tests were carried out in accordance with ASTM E779-19, and the impacts of building archetype, air barrier system, height, and enclosure area on the airtightness are investigated.
Methodology
The following sections outline the methodology used in this study to obtain the airtightness data.
2.1 Test buildings
The data used for the study are test results from 29 buildings collected over four years, comprising 20 new constructions and nine existing buildings. These buildings can be categorized into the following archetypes: residential, office, institutional, mixed-use, community centre, courthouse, and hotel. Air barrier strategies used for buildings are window wall (WW), interior sealed membrane (ISM), taped weather resistive barrier (TWRB) and self-adhered membrane (SAM). The building volume ranges from 369 to 104,570 m3 (13,030 to 3.7 million cf) with the average volume being 17,795 m3 (628,200 cf). Similarly, the enclosure area ranges from 200 to 17,161 m2 (2,150 to 184,700 sf) with an average area of 5,089 m2 (54,770 sf). An average of five storeys is seen in the data, with a minimum of one storey and a maximum of 21 storeys, and building heights ranging from about 5 to 93 m (16 to 305 ft). Table 1 summarizes the test building data and the air leakage parameters.
2.2 Building preparation
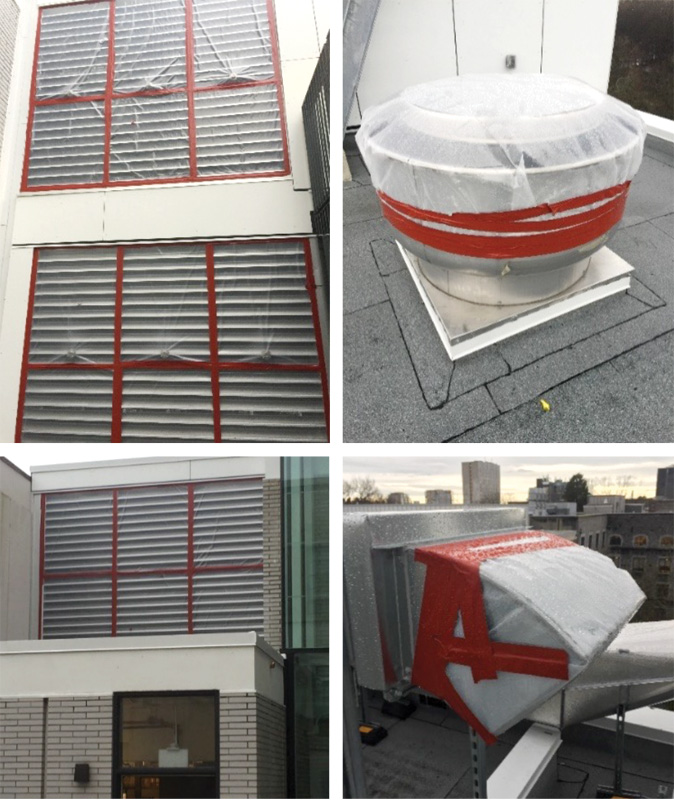
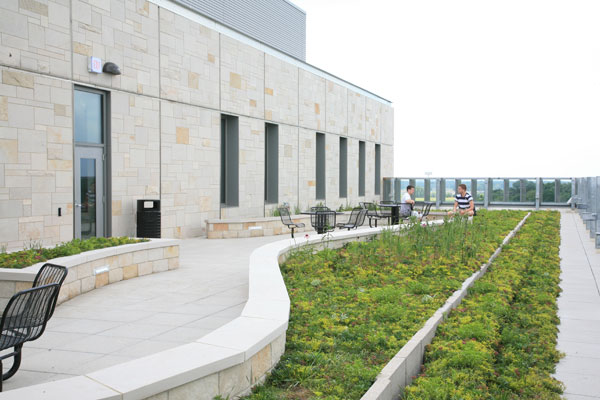
The goal of the airtightness tests was to test the air barrier of the buildings. As a result, building preparation was required to be completed before conducting the airtightness test. All interior doors within the pressure boundary were left open to achieve a uniform pressure in every room throughout the building. All exterior doors not being used for the fan set-up were closed, locked if possible. Doors to areas excluded from the pressure boundary were sealed off. All exterior windows were closed and locked. Ventilation openings in the building envelope area were sealed through the use of poly barriers taped to the exterior louvers/openings. Figure 1 shows building preparation for an institutional building (i.e. all intentional openings are sealed).
2.3 Test method
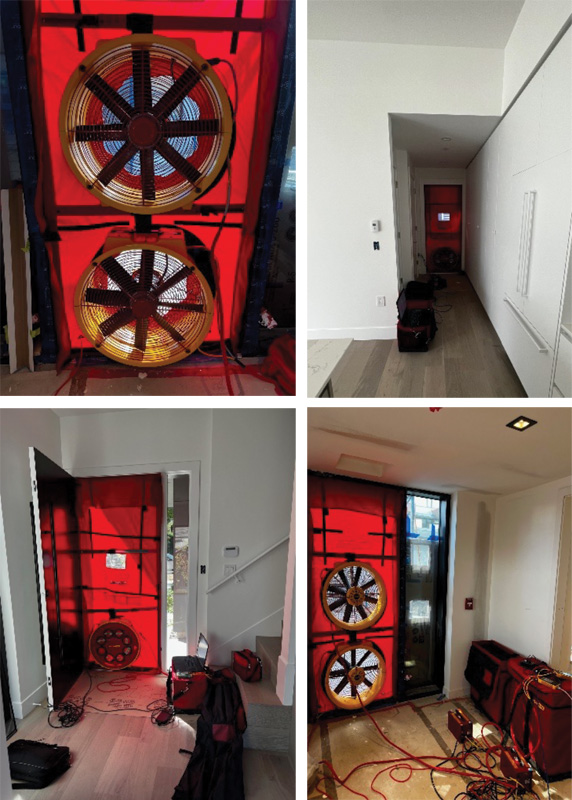
To create an induced pressure in the building enclosure, fans were used for the airtightness tests as they can uniformly pressurize/depressurize the space. Retrotec Model 6000 blower door fans were used for testing, and the number of fans required for each test was based on a calculation using the height of the building above ground, enclosure volume, building floor area, and enclosure area (floor, ceilings, and walls) of the building’s pressure boundary. Those blower door fans were connected to Retrotec Model DM-32 fan control gauges, which were used to automatically control the test from a central location. The test calculated data in two conditions: pressurization and depressurization. Figure 2 illustrates the fan setup for a whole building airtightness test for a 15-storey residential building with six fans.
The fans were set up at exterior doors throughout the building enclosure between ambient conditions (outdoors) and the interior pressure boundary. This setup assists with achieving uniform induced pressure across the pressure boundary as required by ASTM E779. Before pressurizing or depressurizing the space, pressure sensor tubes measure the baseline bias (zero flow) pressure. Additionally, pressure sensor tubes were placed within the interior pressure boundary, and the pressure of the building interior was measured and averaged by the Retrotec software (Fantestic Pro). In accordance with ASTM E779-19, the software also calculates the pressure difference between each interior reference location and the average interior pressure, ensuring there is no more than 10 per cent difference to confirm the interior pressure is uniform throughout the building. The tests were done in conformance with ASTM E779-19 with the following modifications: i) tests were conducted for both pressurization and depressurization, ii) the test pressure range was from 25 to 80Pa (0.52 to 1.67 psf), and iii) intentional openings in the enclosure were sealed during the test.
2.4 Data analysis
The power law equation in Equation (1), was used to calculate the airflow through the building enclosure where Q is the volumetric airflow rate (m3/s), ∆P is the pressure difference between the ambient conditions and the interior pressure boundary (Pa), C is the air leakage coefficient (m3/s/Pan), and n is the pressure exponent (dimensionless).2
Q=C(∆P)n
Equation (1) is used to calculate the airflow rate (Q) between the ambient conditions and the interior pressure boundary. The values for pressure exponent (n) range between 0.5 and 1.0 to conform with the power law equation and to reflect whether the flow is completely turbulent or laminar, respectively.20 To get the values of the air leakage coefficient (C) and pressure exponent (n), unweighted, log-linearized, linear regression analyses were calculated at various pressure differences. Q was then extrapolated at the reference pressure difference.2,20
The metric that is typically used to report the air leakage of large buildings is normalized leakage rate (NLR75). Test results for different projects can be compared with NLR75 as it normalizes the air leakage over the envelope area at 75Pa (1.57 psf). The equation for NLR75 is seen in Equation (2), where Q is the volumetric airflow rate at 75Pa (1.57 psf) (m3/s), andA is the area where the pressure difference is observed, e.g. enclosure area (m2).32 The values of NLR are typically reported in (l/s/m2), and the same convention has been used in this study.
NLR75Pa= Q75Pa ×1000
Another metric that is typically used to report the air leakage rate is Equivalent Leakage Area at 10 Pa (0.21 psf) (EqLA10Pa), and it can be calculated as follows:
EqLA10Pa= Q10Pa/0.61√ρ/2ΔP
Where [m3/s] is the air flow at 10Pa, (kg/m3) is air density, and is 10 Pa (0.21 psf).
Results
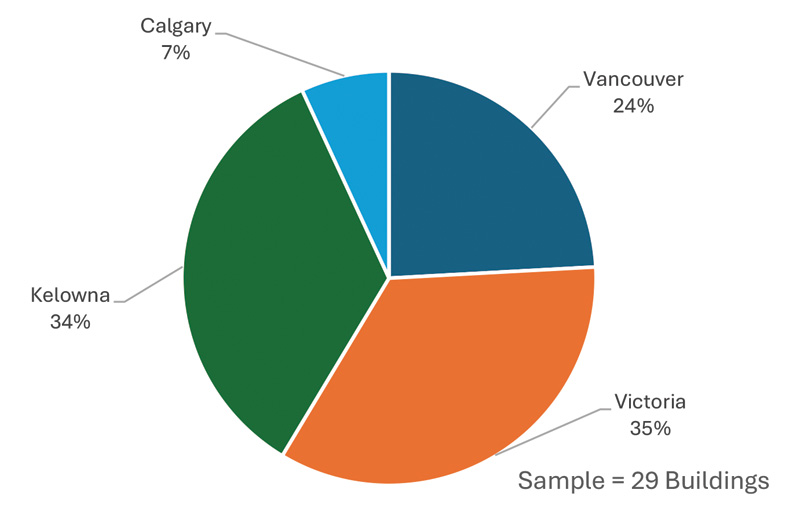
This section presents the results of the conducted airtightness tests. As seen in Figure 3, the tested buildings are primarily located in British Columbia, and two buildings are in Calgary, Alberta. It should be noted that at the time of writing this paper, there is no airtightness requirement in Alberta; however, performing a whole-building airtightness test is mandatory in BC under the BC Energy Step Code.
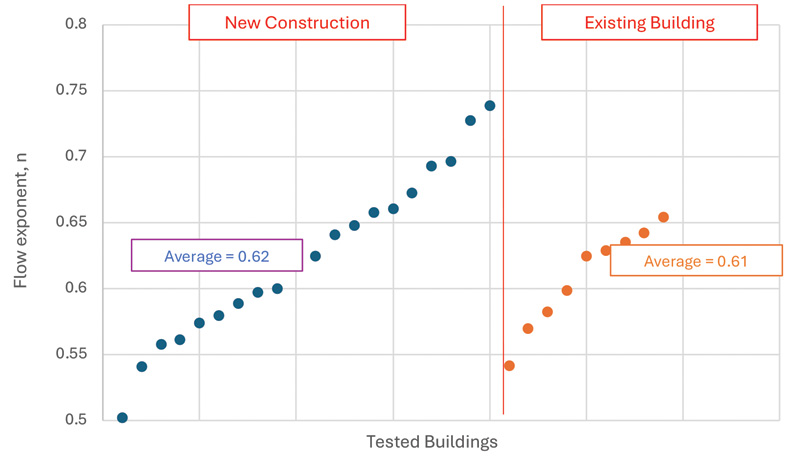
As discussed earlier, C (air leakage coefficient) and n (pressure exponent) are two factors that describe the physics of fluid flow, where n=1 represents a fully laminar flow and n=0.5 represents a turbulent flow through a sharp edge orifice.20 Since flow through air leakage paths of the air barrier is a combination of laminar and turbulent flow, the values of n are always between 0.5 and 1 for the actual airtightness test. In the absence of multi-point testing to precisely determine the pressure exponent (n) value for a specific building, the industry has conventionally relied on assuming a value of 0.60 or 0.65. To evaluate the suitability of these assumptions, an analysis of the measured pressure exponents for the tested buildings within the database was conducted and is depicted in Figure 5. The calculated average of the pressure exponents was determined to be 0.61-0.62, aligning closely with the frequently adopted values of 0.6 and 0.65. A value of 0.63 is reported in reference 33, and it is pointed out that using a value of 0.6 is gaining wider industry acceptance, which aligns well with the findings of this study.
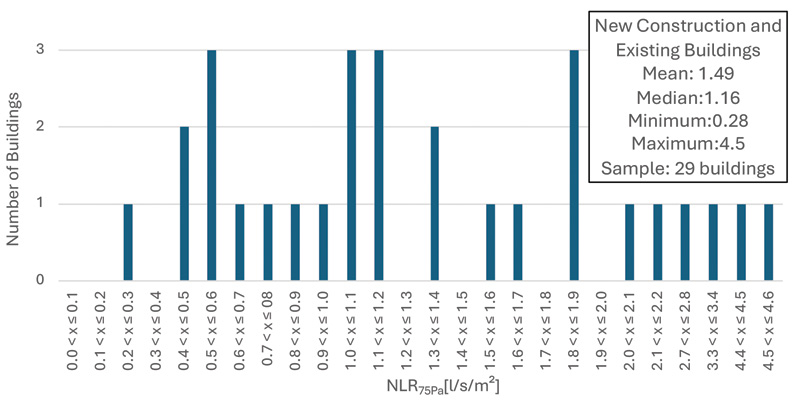
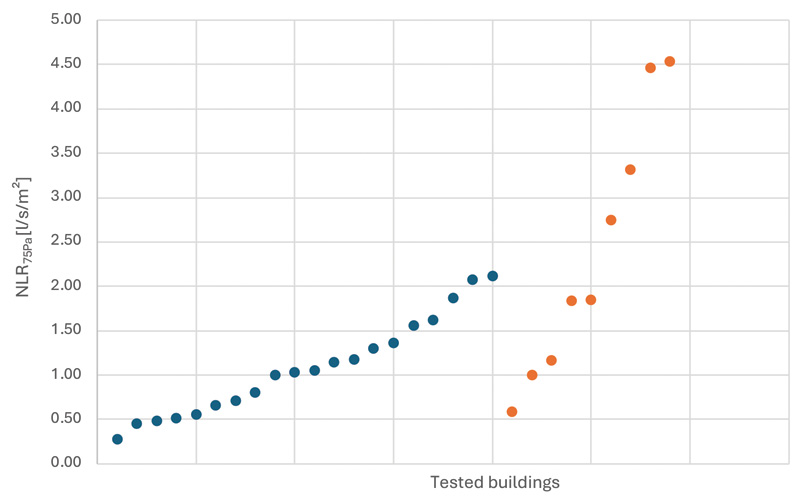
Figure 6 shows the distribution of airtightness data. As seen in Figure 6, the airtightness of the majority of buildings falls below 1.9 (l/s/m2) with only six buildings (~20 per cent of the data) having NLR75Pa higher than 2 (l/s/m2). As mentioned before, most of the existing buildings in the dataset manifested high air leakage, except the ones that underwent a full envelope retrofit.
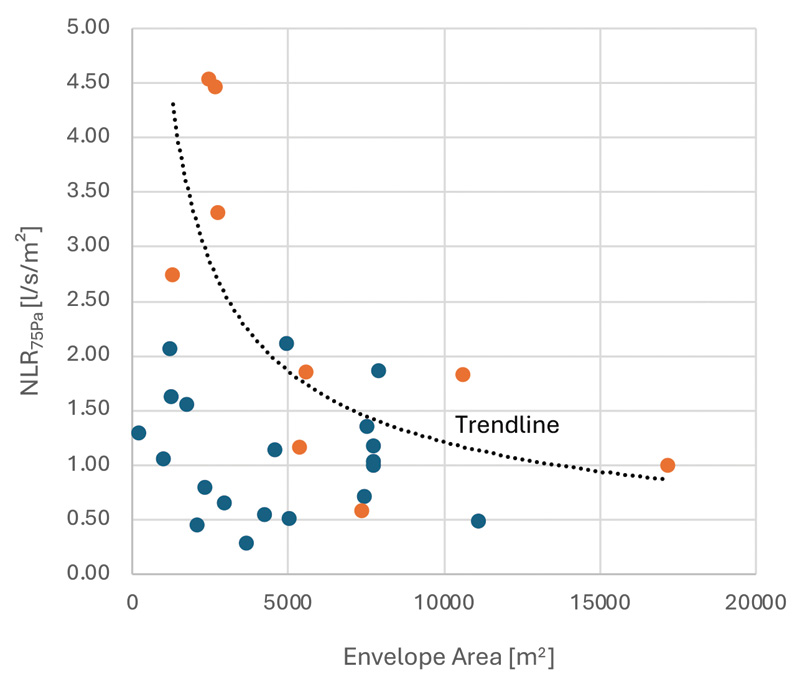
The analysis of the airtightness data was extended to examine its correlation with the building envelope area as illustrated in Figure 7. Based on this analysis, the airtightness of buildings increases with the building envelope area. However, one may argue that because buildings with larger enclosure surface area are generally taller, a more robust air barrier system had to be used to withstand higher wind and stack pressures.
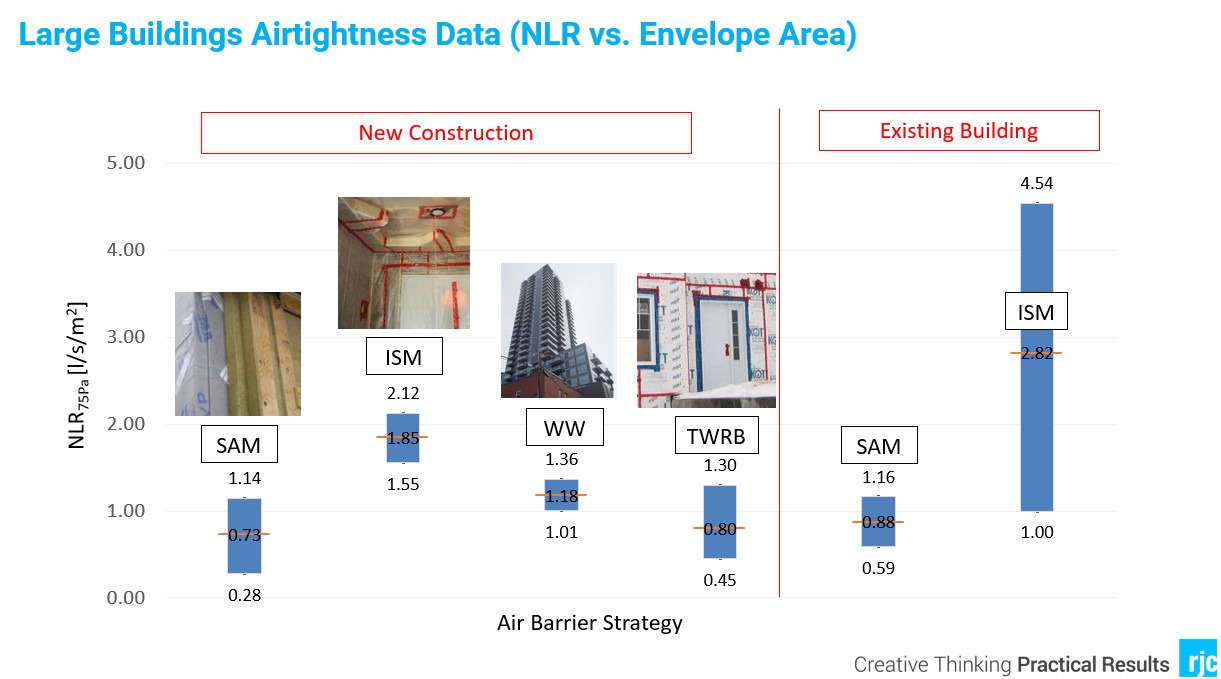
Figure 8 further investigates the impacts of the air barrier strategy on the airtightness of the tested buildings. Four main air barrier strategies that had been used in the tested buildings were: interior sealed membrane (ISM), exterior self-adhered membrane (SAM), taped weather resistive barrier (TWRB), and window wall system (WW). It is evident from Figure 7 that buildings with SAM and TWRB demonstrate better airtightness levels compared to other buildings in the dataset. In addition, the high-performance characteristics of SAM have been confirmed for both new construction and existing buildings in the dataset. A wide range of performance was determined for the ISM approach compared to other strategies, making the results prone to the quality of installation, detailing, and workmanship. In general, the values obtained for SAM and TWRB were almost an order of magnitude lower than other data.
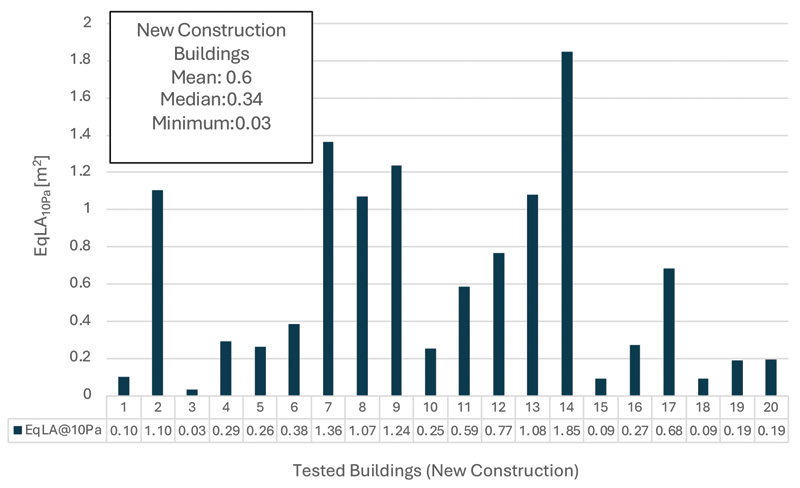
Figure 9 shows the EqLA @10Pa (0.21 psf) in m2 for the tested new construction projects. EqLA is a metric used to represent the size of a hypothetical sharp-edged orifice that would allow the same amount of air flow at a specific pressure (in this case, 10 Pa [0.21 psf]) as the cumulative air leakage through all the actual leakage paths in a building enclosure. It helps in comparing the air leakage characteristics of different buildings or assessing the effectiveness of air sealing measures. The 10 Pa (0.21 psf) reference pressure is commonly used in building performance testing to simulate real-world conditions. As seen in Figure 9, the EqLA for the tested buildings ranges from 0.03 to 1.8 m2 (0.32 to 19.38 sf). The average EqLA was determined to be 0.6 m2 (0.65 sf) with a median value of 0.34 m2 (3.6 sf).
Conclusion
This paper represents the data gathered for whole building airtightness testing of 29 large and multi-zone buildings. This study was conducted over a span of four years, and the main goal of the tests was to address the scarcity of available airtightness data for large buildings. The following conclusions can be drawn from this study:
- Existing buildings which had undergone a major envelope retrofit manifested an exceptional airtightness level compared to other existing buildings in the dataset.
- New construction projects generally demonstrate a better airtightness level compared to existing buildings.
- An average of 1.09 [l/s/m2] and 2.39 [l/s/m2] was calculated for the airtightness levels of
the tested new construction and existing buildings, respectively. - An average value of 0.61–0.62 was determined for the pressure exponent value of pressure-flow equation, which aligns with existing literature.
- The airtightness of the tested buildings increases with building enclosure area; however, this might be related to better air barrier strategies used for larger buildings.
- The air barrier strategy has a significant impact on airtightness. Exterior SAM and TWRB demonstrate order of magnitude improvements over other methods.
This study provides a platform to establish a new benchmark for airtightness targets of new construction buildings. The current airtightness level of 2 (l/s/m2) @75Pa (1.57 psf), which is addressed in the VBBL and other resources,34 seems fairly achievable. It should be reduced to observe a continuous improvement in the airtightness of the built environment.
References
1 G. Proskiw, B. Phillips, Air leakage characteristics, test methods and specifications for large buildings, Canadian Mortgage and Housing Corporation (CMHC), (2001).
2 R. Urquhart, R. Richman, G. Finch, The effect of an enclosure retrofit on air leakage rates for multi-unit residential case-study building, Build. Environ. 236 (2023) 110273.
3 C. Younes, C. Abi Shdid, G. Bitsuamlak, Air infiltration through building envelopes: A review, J. Build. Phys. 35(3) (2011) 267-302.
4 M. H. Sherman, Estimation of infiltration from leakage and climate indicators, Lawrence Berkeley National Laboratory (LBL), (1987).
5 T. Patel, C. Mitsingas, J. P. Miller, T. A. Newell, Comparison of blower door and tracer gas testing methods for determination of air infiltration rates through building envelopes at normal operating conditions, Proceeding of the ASME 2011 5th International Conference on Energy Sustainability, Washington, USA (2011).
6 S. Michalski, Leakage prediction for buildings, cases, bags and bottles, Studies in Conservation 39(3) (1994) 169-186.
7 G. Finch, J. Straube, C. Genge, Air leakage within multi-unit residential buildings-testing and implications for building performance, in: Proceeding of the 12th Canadian Conference on Building Science and Technology
ASHRAE 2005.
8 G. T. Tamura, Measurement of air leakage characteristics of house enclosures, ASHRAE Trans. (1975) 202-211.
9 I.S McIntyre, C.J. Newman, The testing of whole houses for air leakage, Prince Risborough Laboratory, (1975).
10 G.E. Caffey, Residential air infiltration, ASHRAE Trans. (1979).
11 S. Stricker, Measurement of air leakage of houses, Ont. Hydro Res. Q. (1974) 11-18, 4th Quarter.
12 H.W. Orr, D.A. Figley, An exhaust fan apparatus for assessing the air leakage characteristics of houses, (1980).
13 L.E. Nevander, J. Kronvall, in: Airtightness of buildings- research in Sweden, (1978) Paris France.
14 J. Kronval, “Air tightness measurements and measurement methods”, Report D8, Swedish Council for Building Research, Stockolm, (1980).
15 A. Blomsterberg, “Air leakage in dwellings”, Dept. Bldg. Constr. Report No 15, Swedish Royal Institute of Technology, (1977).
16 G.E. Caffey, “Residential air infiltration”, ASHRAE Transactions, 85 (9) (1970) 41-57
17 D.T. Harrje, A. Blomsterberg, A.K. Persily, “Reduction of air infiltration due to window and door retrofits”, CU/CEES Report 85, Princeton University, (1979).
18 M. H. Sherman, D.T. Grimsrud, Infiltration-pressurization correlation: simplified physical modeling, ASHRAE
Trans. (1980).
19 C. Thompson, A Review of building airtightness and ventilation standards, International Energy Agency, Technical note AIC 14, (1984).
20 A. Melois, F.R. Carrie, M.EI Mankibi, B. Moujalled, Uncertainty in building fan pressurization tests: review and gaps in research, J. Build. Eng. 52 (2022) 104455
21 ASTM Standard E779-81; Standard practice for measuring air leakage by the fan-pressurization method; 1981; American Society for Testing and Materials; USA; 1981.
22 CGSB Standard 149-GP-lOM; Standard for determination of airtightness of buildings by the fan-depressurization method (fifth draft); 1983; Canadian General Standards Board.
23 I.S. Walker, M.H. Sherman, J. Joh, W.R. Chan, “Applying large datasets to developing a better understanding of air leakage measurements in homes”, Int. J. Vent., 11 (2013)
24 J. Love, J. Wingfield, A.Z.P. Smith, P. Biddulph, T. Oreszczyn, R. Lowe, C.A. Elwell, “Hitting the target and missing the point’: analysis if air permeability data for new UK dwellings and what it reveals about the testing procedure, Energy Build. 155 (2017) 88—97.
25 A.B. Melois, B. Moujalled, G. Guyot, V. Leprince, “Improving building envelope knowledge from analysis of 219,000 certified on-site air leakage measurements in France, Build. Environ. (2019).
26 G. Proskiw, A. Parekh, “A proposed test procedure for separating exterior envelope air leakage from interior partition air leakage”, in: Proceedings: Performance of exterior envelopes of whole buildings, 6 (2001) 2-7.
27 LBNL, “Indoor-outdoor air leakage of apartments and commercial buildings”, LBNL, (2006).
28 R.C. Diamond, H.E. Fuestel, D.J. Dickerhoff, “Ventilation and infiltration in high-rise apartment buildings, Lawrence Berkeley National Laboratory, Berkeley, CA, 1996.
29 T. Brennan, G. Nelson, W. Anis, C. Olson, “ASHRAE 1478: measuring airtightness of mid and high-rise non-residential buildings”, in: Proceedings: Thermal performance of the exterior envelopes of whole buildings XIII International Conference, (2013)
30 L. Ricketts, “Impact of large building airtightness requirements”, in: Proceedings: Thermal performance of the exterior envelopes of whole buildings XIII International Conference, (2016).
31 D. Jones, B. Brown, T. Thompson, G. Finch, “Building Enclosure Airtightness Testing in Washington State – Lessons Learned about Air Barrier Systems and Large Building Testing Procedures”, In: Proceedings of the ASHRAE 2014 Annual Conference. Seattle, WA.
32 “Study of Part 3 Building Airtightness,” Project 8980.00, RDH Building Science Inc., (2015).
33 “Air leakage control in multi-unit residential buildings: Development of testing and measurement strategies of quantity air leakage in MURBs”, Project 5314.00, RDH Building Science Inc., (2013).
34 “BC Housing Design Guidelines and Construction Standards”, BC Housing, (2019)
Authors

Dr. Mohammad Fakoor is the technical lead for the building performance team at RJC Engineers. His work involves project work, technical review, and education on energy modelling, airtightness testing, research, and carbon life cycle analysis (LCA).

Parvin Asadi, P.Eng., is a building performance project engineer at RJC Engineers. She focuses on energy modelling and performance analysis for new construction and retrofit projects. She specializes in integrating mechanical systems and building enclosures to enhance energy efficiency and overall building performance.

Danielle Arciaga, E.I.T., is a building performance engineer at RJC Engineers who specializes in carbon life cycle assessments (LCA) in the built environment. She has a strong foundation of embodied carbon principles and requirements for designing a low-carbon building, having worked on both new construction and retrofit projects.
Sign up for our weekly newsletter
Construction Canada weekly newsletters give the latest AEC industry news for those who build, design, engineer, specify, renovate or operate in the built environment.
Related Products & Services
Read the Latest Issue