Surveying the 2023 design/construction landscape
by arslan_ahmed | May 25, 2023 7:00 am
The specified slider id does not exist.
[1]For 13 years, Construction Canada has conducted an annual survey to gather insights from readers about the state of the industry. The survey offers a glimpse into the daily operations of the architecture, engineering, construction, and operation (AECO) professionals who are responsible for designing, constructing, and maintaining various structures such as condominium towers, hospitals, schools, and offices.
Construction Canada is the official publication of Construction Specifications Canada (CSC). An interdisciplinary association, CSC brings together professionals from across the building industry. Its membership includes architects, specifiers, engineers, project managers, product manufacturers’ representatives, contractors, and other experts across the architecture, engineering, and construction spectrum.
While the majority of the survey respondents are not CSC members, the participation of a diverse group of professionals provides a broader perspective on the current state of the industry. The survey covers a range of topics such as income, social media usage, job satisfaction, and future predictions. Hundreds of participants across the country provided insights into the current state of the industry and potential future trends.
Once again, we received responses from various parts of Canada, including every province and even territories, with Ontario having the most survey participants this year, comprising 162 respondents. British Columbia and Alberta followed as the second and third most represented provinces, respectively, similar to last year’s results. There has been a slight decrease in the percentage of female respondents, who now make up 24 per cent of the total, down from 27 per cent in the previous two surveys. However, it is noteworthy that female respondents reported earning salaries of $100,000 or more at a higher rate this year, with 42 per cent compared to 22 per cent last year. In contrast, 50 per cent of male respondents reported the same, down slightly from 51 per cent last year. Despite a significant age gap remaining, with more than half of the surveyed individuals over the age of 50, there has been an increase in the number of new entrants to the industry this year, rising from 12 to 14 per cent. Further, there has been a notable shift in the occupational longevity category, with nearly half of all participants having been in the industry for 30 years or more. Architects continue to be the largest group of respondents, with representation from specifiers, engineers, project managers, and general contractors as well.
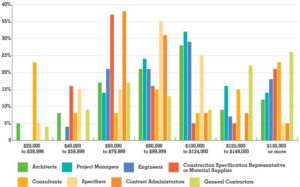
Who makes what?
The following charts show the percentage of respondents in each salary range for specific job titles.
 [2]
[2]
 [3]
[3]
 [4]
[4]
Work-life balance
 [5]
[5] [6]According to Statistics Canada, Canadians aged 25 to 54 worked an average of 40 hours per week in 2022. While 53 per cent of survey respondents fell within this range, 37 per cent worked more than 40 hours, with some working more than 60. Despite a two-year trend of decreasing satisfaction with work-life balance, this year’s survey showed 76 per cent of respondents were content with their balance, representing a four-point increase from the previous year. However, a significant number of participants still felt they dedicated too much time to work, limiting their personal or family life. Those who were unhappy cited workload, stress, and burnout as the primary reasons for their response. In contrast, those who were satisfied mentioned flexible hours, the option to work remotely, and actively prioritizing a healthy balance as reasons for their contentment.
 [7]
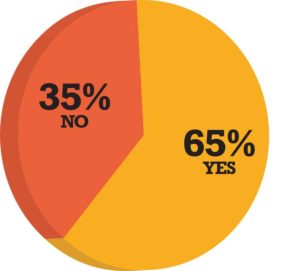
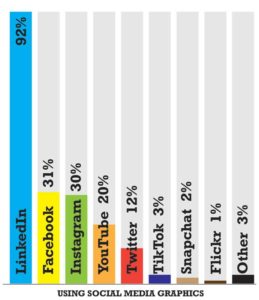
[7]Relevance of social media
The trend of using social media for networking or research continued for the fourth consecutive year, with 65 per cent of respondents saying they use it for this purpose. LinkedIn (92 per cent) was overwhelmingly the most popular social media platform used across all positions in the industry, followed by Facebook (31 per cent), and Instagram (30 per cent). The primary factor contributing to the increased usage of social media is its networking capability, according to many respondents.
According to one respondent, “social media provides a great platform for connecting with potential clients, sharing project updates, and showcasing completed projects. It also allows for more direct communication with potential clients. Additionally, social media can be used to promote events and share valuable resources with the community.”
 [8]One respondent says they use social media to “get up-to-date info on what others are doing and what is new and up and coming.” Another said, “Connections that are made can be maintained even as individuals move to new positions in new companies.”
Despite the benefits of social media, survey participants also pointed out several fundamental problems associated with it.
Some people described feeling cautious or hesitant due to the prevalence of privacy concerns and misinformation. “There are too many opportunities for falsification of information on social media and once something is out there it never goes away. Sites like Facebook and Twitter are not an appropriate platform for professional discourse,” said one reader.
Others simply said they do not have time for it and do not care to use it. Another respondent wrote, “I like to keep my life and work off the internet.”
 [9]
[9]Commuting versus remote office
More than 80 per cent of respondents reported having the choice to work remotely or follow a hybrid working model. This flexibility played a crucial role in many respondents’ positive work-life balance, as it allowed them to disconnect from work or save commuting time. In fact, a significant number of participants attributed their contentment to the ability to work remotely.
 [10]
[10]“Our company works with our flexible schedules, allowing us to balance days that need more hours for deadlines with hours needed for personal responsibilities and life,” said one response.
Another stated, “Work from home and working with a laptop has made it flexible to get in personal hours. My employer strongly encourages not to exceed typical 40 hours per week for work/life balance.”
“I work from home; I can start later and work later. The pay is great, affords me many personal benefits including travel and disposable income,” said a third.
Although many are taking advantage of the benefits of being able to cut out the commute, it does not necessarily work for everyone.
“Commuting times and the intrusion of work into personal time due to “remote work” measures have eroded work-life balance to a degree and is difficult to reverse the impacts,” said one respondent.
Another stated, “Working from home may not always have an end of a workday/week.”
The nature of the business
The specified slider id does not exist.
 [11]
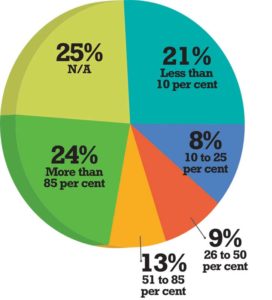
[11]Green and BIM
The use of building information modelling (BIM) in the built environment remained consistent year-over-year. Thirty-seven per cent reported working on projects that use BIM, which is a six per cent increase from the previous year. Additionally, 24 per cent reported using BIM in more than 85 per cent of their projects, indicating the growing importance of this type of software. While the increase in BIM usage was not as significant as the previous year, where the percentage rose from zero to 23 per cent, the trend continued with a modest one per cent increase in this year’s survey.
 [12]
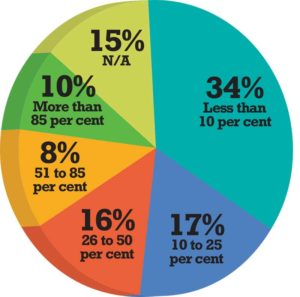
[12]The use of sustainable initiatives remained relatively stable compared to the previous year. However, the proportion of respondents who worked on eco-friendly projects for over 50 per cent of their time decreased by two per cent from the previous year’s survey.
 [13]What does the future have in store?
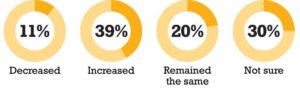
The lifting of COVID-19 restrictions last year boosted optimism in the industry. However, the pandemic’s impact on industries and economies still lingers, and this year’s respondents are less optimistic about the future. In the previous year, more than 50 per cent believed the next five years would be better than the last five, with a four per cent increase from 2021. This year, however, the percentage of those who felt this way decreased by eight per cent. The survey also revealed a five per cent decline in the number of respondents who reported their company profits increased or remained the same over the past five years. Interestingly, the percentage of those who reported
a decrease in profits remained the same as last year
(11 per cent), while an identical five per cent said they were unsure about their company’s profitability. The participants’ comments in the survey reflected their apprehension about the future.
 [14]
[14]“I feel the economy has declined and people are being more careful with how they spend their money. Interest rates have given people a pause for larger projects. Inflation has also curbed people’s spending on renovations along with the decline in the resale market has made people push the pause button as they wait to see what their house is presently worth,” said one respondent.
“COVID-19 caused a lot of additional costs, which did not help our revenue, although we had some additional approved funding for this. And delays in completing a number of projects in progress and new ones to start,” said another.
One respondent wrote, “The problem is the labour force—more jobs to bid on, but it’s hard to bid when you don’t have the workforce to do it.”
 [15]
[15]It was not all doom and gloom as other respondents also shared cautious hope for the future.
“As the economy gets better after inflation and COVID, more projects will be presented,” said one respondent.
Another reader echoed this sentiment. “The economy will stabilize, and momentum of new work will remain constant.”
We also asked what the single biggest factor could be impacting design/construction firms over the next few years. Here are some of the important considerations:
- Increased interest rates will cause a decline in developers pursuing larger projects.
- Interest rates and government decisions.
- Changing work environments affecting vacancy rates
in office buildings. - Retaining employees in a competitive work environment.
- Inflation/borrowing rates leading to less construction.
- Demand for housing and affordable housing efforts.
- Adapting to changing customer needs and preferences, as well as the changing landscape of the architecture industry.
- Sector booms in agriculture, mining, forestry, construction.
The specified slider id does not exist.
: https://www.constructioncanada.net/wp-content/uploads/2023/05/ReadersGender.jpg- [Image]: https://www.constructioncanada.net/wp-content/uploads/2023/05/WhoMakesWhatMF.jpg
- [Image]: https://www.constructioncanada.net/wp-content/uploads/2023/05/whoMakesWhat.jpg
- [Image]: https://www.constructioncanada.net/wp-content/uploads/2023/05/WorkLife_Collage.jpg
- [Image]: https://www.constructioncanada.net/wp-content/uploads/2023/05/EducationDesignations.jpg
- [Image]: https://www.constructioncanada.net/wp-content/uploads/2023/05/Top5Positions.jpg
- [Image]: https://www.constructioncanada.net/wp-content/uploads/2023/05/Graphic_SocialMedia_NetworkingResearch.jpg
- [Image]: https://www.constructioncanada.net/wp-content/uploads/2023/05/SocialMediaUsage.jpg
- [Image]: https://www.constructioncanada.net/wp-content/uploads/2023/05/WorkLifeFaces.jpg
- [Image]: https://www.constructioncanada.net/wp-content/uploads/2023/05/Graphic_DelicateBalance_Remotely.jpg
- [Image]: https://www.constructioncanada.net/wp-content/uploads/2023/05/Graphic_SocialMedia_Bim.jpg
- [Image]: https://www.constructioncanada.net/wp-content/uploads/2023/05/Graphic_SocialMedia_Green.jpg
- [Image]: https://www.constructioncanada.net/wp-content/uploads/2023/05/ThinEconomyNegAffects.jpg
- [Image]: https://www.constructioncanada.net/wp-content/uploads/2023/05/Graphic_FiveYears.jpg
- [Image]: https://www.constructioncanada.net/wp-content/uploads/2023/05/Graphic_Profitability.jpg
Source URL: https://www.constructioncanada.net/surveying-the-2023-design-construction-landscape/